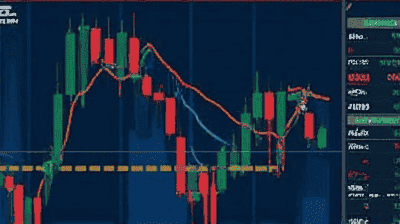
Investing in the stock market can be an exciting yet daunting task. For many investors, the key to success lies in understanding when to enter and exit positions. Technical analysis provides a framework to enhance decision-making by analyzing historical price data and trading volumes to predict future price movements.
Technical analysis is a method used by traders and investors to evaluate securities by analyzing statistics generated from market activity. This includes examining historical prices and trading volumes to identify patterns and trends that can forecast future price movements. By focusing on market data instead of a company's fundamental value, technical analysts aim to make informed trading decisions.
Some essential concepts in technical analysis include:
While technical analysis focuses on price movements and trading volume, fundamental analysis evaluates a company's intrinsic value based on financial statements, earnings, and other economic factors. Both approaches have merits, and many investors use a combination of both methods to refine their strategies.

Price charts are foundational tools in technical analysis, and they come in various forms:
Technical indicators and oscillators help traders analyze price and volume trends. Some common indicators include:
Trend lines are straight lines drawn on charts that connect significant price points, helping to identify the overall direction of a stock. Channels are created by drawing parallel trend lines, creating an upper resistance line and a lower support line, allowing traders to visualize potential price movements within those boundaries.
Support and resistance levels are critical for identifying entry points. Support refers to a price level where a stock tends to stop falling and may bounce back up, while resistance is where it struggles to go higher. Investors look for opportunities to buy near support levels, as those may represent advantageous entry points.
Candlestick patterns provide valuable information about market sentiment. Some popular patterns include:
Moving averages can signal potential entry points:

Determining exit points is as crucial as identifying when to enter a trade. Setting target prices involves establishing a predetermined price level at which to sell for a profit. Common techniques for setting target prices include:
Traders employ various exit strategies based on technical indicators:
Stop-loss orders are essential tools for managing risk and protecting capital. By setting a stop-loss order at a specific price, traders can limit potential losses. It's crucial to determine a stop-loss level consistent with technical analysis, such as below support levels or moving averages.
Understanding market sentiment can enhance technical analysis. Tools like the Fear and Greed Index, investor sentiment surveys, and news sentiment analysis can provide context that helps confirm trade decisions.
While technical analysis focuses on price movements, integrating fundamental analysis can add depth to decision-making. Fundamental factors like earnings reports, news events, and economic data can influence technical patterns and help investors make more informed choices.
Successful investors employ sound risk management techniques to protect their capital:

Consider a hypothetical example of a trader using technical analysis on Company XYZ:
Historical case studies, such as the analysis of tech stocks during the dot-com bubble, reveal how technical analysis can identify both entry and exit points:
Many investors make the common mistake of relying heavily on technical indicators without considering the broader market context. It is essential to use a combination of indicators and analysis methods for more robust decision-making.
Ignoring overall market conditions can lead to poor investment decisions. For example, even if technical analysis signals a potential buy, investigating broader economic or market trends is crucial. A weak market may pummel even the strongest stocks.
Successful trading requires discipline. Deviating from predetermined entry and exit points due to emotional reactions can result in losses. Stick to a well-structured plan and avoid impulsive decisions based on immediate market movements.
Technical analysis serves as a powerful tool for investors seeking to identify entry and exit points in stocks. By understanding key concepts such as support and resistance levels, using various tools and indicators, and combining technical analysis with sound risk management strategies, investors can refine their decision-making processes.
While market timing may remain elusive for many, employing a systematic approach to technical analysis enables traders and investors to enhance their chances of success. By learning and applying these techniques, you equip yourself with practical skills that can lead to more profitable investments and long-term financial gains.